

Two weeks ago, a post of mine were published on Heise Online: Gib mir eine Zahl. Obviously, it is only available in German. Therefore, I publish here my English version.
Introduction
Who works in the software industry experienced or better suffered effort estimations in one or other way. Either he or she was on the management side and had questions like “Why is the effort so high for such an easy thing?” or “How can cover our turnover such high costs?”. Or he or she was on the expert side, where warnings about risks were simply not listen to. This principle contradiction is not solved by this post as well. But the post will give hints, how responsible people on both sides can handle this contradiction. Estimation methods are techniques for estimations not for measurement, and they are per se inaccurate. When responsible people are aware of what this inaccuracy means and how they have to handle it, a lot is won already.
Usually it is not an option, not to give any estimation. Planning is to be done, budgets have to be meat. All those things have to have costs and effort estimations as base. How else should the right people in right number come into the project? To give estimations, which cover all possibilities, are much too high usually. No wonder, that the management in the enterprise is revoking them. So, what is to do?
I want to present different estimation methods in this post, which have been proved their worth in the different states of software development.
As sample serves a software project of middle to high complexity. Different estimation methods are presented, which can be applied depending on the according project status.
First Ideas
First ideas are created quite differently. Ideas stay in companies quite long before they get some awareness be the management. Ideas are valued in scope of potential turnover, strategic impact for the company and costs in an ideal world.
It is not aim of this post to write about product and idea evaluation. That would be a topic of an additional post. But the post wants to show, how efforts as major cost part of a software project can be estimated.
First ideas are not deeply evaluated or even documented. Mostly, a one pager exists, which describes the advantages of the project for the company. Sometimes the consequences of non-performing are listed. Both needs to be balanced out be costs, to be able to value the feasibility of the idea. Further work on it costs money and this has to be refinanced – e.g. by turnover or savings of server capacities.
Effort estimations in a classical sense are not possible at such a state. Therefore one tries to put the ideas in size categories like „XS“, „S“, „M“, „L“, „XL“. The size categories follow the complexity of projects or ideas. Obviously, one estimates in T-shirt sizes.[1].
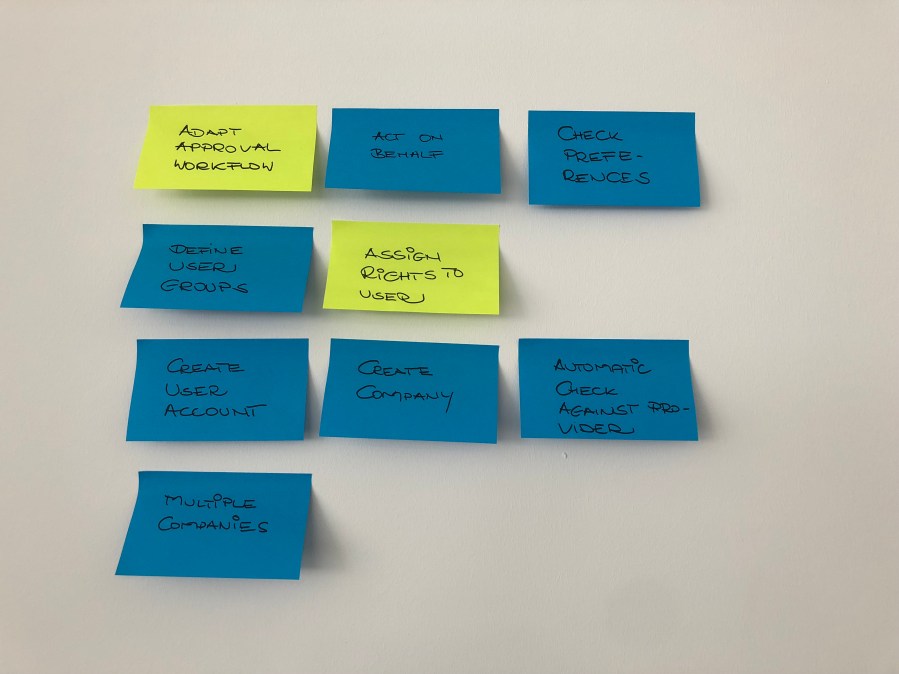
Because all involved people have difficulties to estimate absolute sized, it is recommended to follow the following path: The ideas are printed or written on cards and are setup as batches on the table. One draws the first card from the batch und puts it below “M”. The next card is drawn und the “players” discuss, if it is larger, equal, or smaller than the already open card.

Sample for estimations in T-shirt sizes
This card is put down accordingly. So, it goes further – one drawn card is compared to already open cards and sorted. When a card is larger than “XL”, the whole batch has to go down. The first card becomes an “S” accordingly. When all cards are open, an already performed project is taken, of which the efforts are known. All involved people know this particular project in business and technical point of view. This project serves as gauge. The gauge project is taken as entire project including development, quality assurance and transition into the production.
Now one can put a number to the projects in relation. Obviously for T-shirt sizes is the valid as for each other project, the inaccuracy is increasing as larger the project is. Therefore the known Fibonacci series is applied to the T-shirt sizes as well: 1,2,3,5,8. When the gauge project is for example an S project and produced efforts of 7 sprints of a team of 5 member, then an X project t would produce efforts of 8/2*7 sprints – means 28 sprints.
The sort into those ranges is usually sufficient enough, to get a thumb up or down from management. More elaborate risk estimation or even detailed project plans are neither feasible nor reasonable at this stage.
Business Planning
A detailed business planning requires better, means more detailed effort estimations.
To be able to give effort estimations for a business planning, the ideas should be more elaborated. The application, the service, or the enhancement are broken down into functional blocks. Functional blocks mean here business functions like “Invoice Creation” and not technical components like “PDF Generator”.
For each of those function blocks, a card is written, which is used for the estimations. It is recommended, to handle each project separately. That means, to look at function blocks only of one project. Alternatively, one can estimate several projects, especially when those projects are small.
The first card is put openly down on the table. Then next card is drawn and discussed, if the effort is higher, lower, or comparable to the already open card. When the effort is higher, the card is put above the card. If the effort is lower, it is put below the card. If the effort is comparable, the card is put in parallel to the first card. Further cards can be put down in parallel to already open cards, when the effort is comparable. When efforts or complexities are in between two cards, the new card is sorted between those cards.
Sample for sorted in function blocks
As next step, the project members select a function block, which they know well and estimate it together via planning poker. It is not possible to estimate in User Story Points, because there is neither user stories nor a team. But one can use the scrum series and to put a scale to the numbers of his own, e.g. person prints or person days. In my opinion, person weeks are proved. It is possible to use double, half, or equal, what means the series 2,4,8. It is recommended, to try what is the best for the specific development project.
The parallel cards are now rated in their rows (or buckets). That means, are they really equal or not. According to the rating, they are wandering one bucket higher or lower. Otherwise the single buckets (see bucket estimation[2]) are put to the single numbers of the series.
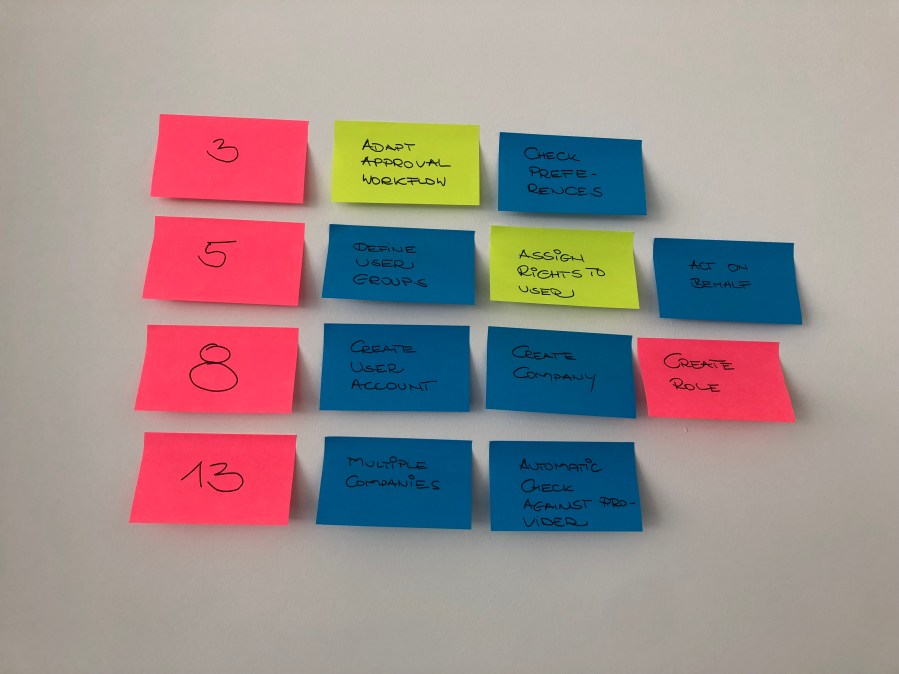
Sample for sorted-in function blocks with scales
One need to be careful in the entire discussion, that no risks or learning efforts (e.g. for new technologies) are part of the estimation. That is done in a next step or parallel separately, when the project members discuss the according block anyhow.
According to the discussed risk, the risk is marked on the card as “High”, “Middle“, or “Small”. More ranks are not reasonable after my experience. Learning efforts or additional efforts e.g. for creation of new IT infrastructures are put in the same ranks. The difference to risks is clear as well: risk can occur, learning efforts and such things occur in every case.
Before the project team discusses what the ranks “High”, “Middle”, and “Small” mean. After my experience, the percent ranks 20%, 50%, and 80% are well-proven. The rank “No risk” should not occur at this project stage – there are too many unknowns at this really early stage. The additional efforts with their ranks can be rated in the same scale as the function blocks, e.g. high efforts with 5, middle efforts with 3, and small ones with 2. No additional efforts can occur (in contradiction to risks), e.g. when the technology is well known.
Scope and Domain Definition, Team Onboarding, Project Kickoff
When the budget is granted, the project members can plan their project. At first step, the scope needs to be defined, to be sure, that expectations and deliverable results are not spreading too much. Then the domains are defined and assigned to the according teams. Inside of the domains, first team members can verify the numbers of the business planning. Ideally those team members are the “The 3 Amigos” [3]: Product Owner, Development, and Tester.
At the project kickoff, one can use the bucket estimation as described above or even a classical planning poker on epics. Again, we don’t have user stories. If it is a small project and a team where the team members well-know each other, it is recommended to use a well-known epic and to rate it with 5. The epics to be estimated are rated according to their complexity – in the same manner as user stories – not in user story points, in epic points J. If not all team members are on board or is the team new staffed, they have to fall back to person days or person weeks. The important point is that all involved in the discussion are working in project later. Unfortunately, that can’t be realized at the project stages “Idea” or “Business Planning” usually.
Comparable to the business planning, it is recommended, to put to each epic risk and learning efforts. The learning efforts can be put down quite precisely for each team member and put down separately. The risk can be estimated in comparable surcharge as in the business planning. But epics with the risk rank “High” should not occur anymore, because open questions in a technical or business point of could be clarified in the time between business planning and project start. There can be epics of course – in contradiction to stage “Business Planning” – which are put into rank “No risk”. From this it follows, that the epics are put down into the risk rank “Middle”, “Low”, and “No risk”. Which means then 50%, 20%, and 0%. Attention, “No risk” or risk of 0% does not mean, that there is no estimation inaccuracy. It only means, that one doesn’t await evil surprises. Again, the project members don’t measure, they estimate.
Implementation
One uses the classical approaches of agile methodologies during implementation: planning poker. It should be in the responsibility of each team, in which scale they estimate. Teams, where the people don’t know each other, have difficulties to estimate in User Story Points. Teams, where the members know each other well, can estimate on base of eaten gummy bears and are right anyhow. It is a constant try and error and of course a good measurement of the team velocity.
One can try again and again, to use other things than ideal person days. Then on can try to use the above described bucket or T-shirt size principles. The important thing is, that the team feels, it is heard. If a team gives constantly too high or too low estimates, it is not the estimation method which is wrong, usually the reason lies in the environment in which team has to work. Constant interruptions e.g. by production issues are only one sample for it.
Summary
Different estimation efforts can be applied in different stages of a project. As earlier the stage is, as more inaccurate is the estimation. The inaccuracy of the estimation should be supported by the estimation method: quite early in T-shirt sizes, during business planning in buckets, and at the project kickoff with a rough planning poker. In this way it is guaranteed, that no accuracy is shown, where no accuracy can be.
[1] T-Shirt Estimations https://www.mountaingoatsoftware.com/blog/estimating-with-tee-shirt-sizes
[2] Bucket System: http://www.agileadvice.com/2013/07/30/referenceinformation/agile-estimation-with-the-bucket-system/
[3] George Dinwiddie’s blog: http://blog.gdinwiddie.com/2011/06/14/podcast-acceptance-test-driven-development-and-the-3-amigos/
